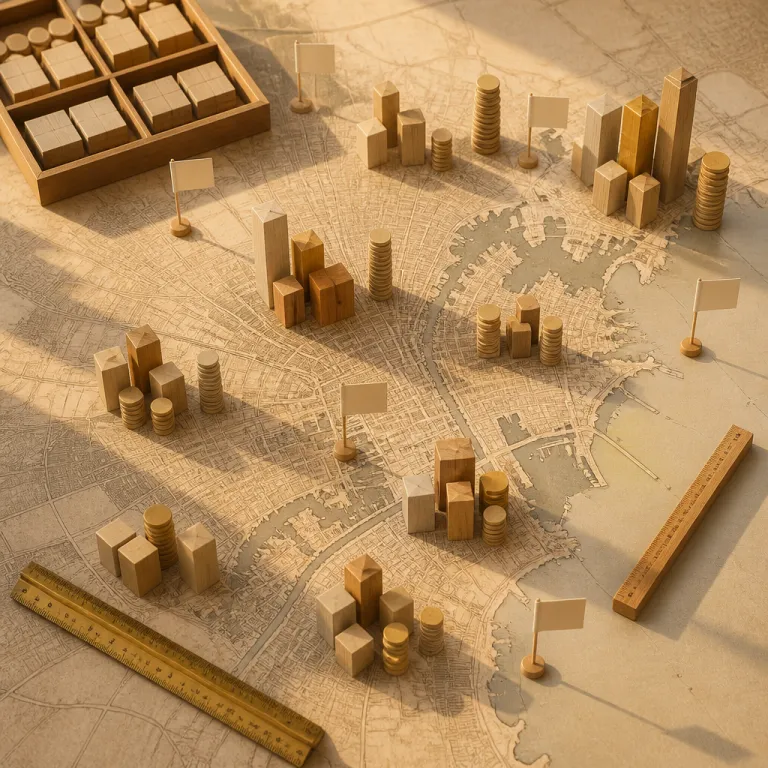
Boston does not publish a census of its hotel rooms. What it does publish is every hotel that went through city development review — and that record is blunt about where the city put its new keys. Of the 4,038 hotel rooms delivered by completed Article 80 projects that state a room count, 2,220 rooms — 55% — sit in five buildings on the South Boston waterfront (Boston Planning Department, Development Projects database, accessed July 29, 2026).
That is not where Boston's hotels historically were: in the same record, Back Bay accounts for 470 completed rooms and Downtown for 359. The Seaport did not add to the old map, it drew a second one — and the pipeline now points somewhere else again.
The city does not count its rooms — the region does
The only current published aggregate is regional: Meet Boston, the Greater Boston Convention & Visitors Bureau, states "over 35,000 hotel rooms in the Greater Boston area" (accessed July 29, 2026). There is no equivalent published room total for the city alone. The closest official figure counts businesses, not beds: the Boston Planning Department's Industry Profiles 2025 records 135 accommodation establishments in Boston as of September 2024.
Performance data is better documented, and it says supply has grown faster than demand. Pinnacle Advisory Group figures published by Meet Boston put Boston at 77.3% occupancy, $301.97 ADR and $233.54 RevPAR in 2025, against 82.5% and $261.31 in 2019: rates 15.6% higher, occupancy 5.2 points lower. The Planning Department's Economy Report 2026 agrees from its own data — 77.7% average monthly occupancy in 2025, unchanged from 2024, with monthly shortfalls of 2.5 to 8.6 points against 2019.
Where the rooms were built
The table counts hotel rooms in projects reviewed under Boston's Article 80 process, split between those the Planning Department marks "Construction Complete" and those approved, permitted or under review. Only projects whose published description states a room count are included, so this is a floor, not an inventory: hotels built before Article 80 review, and projects disclosing no key count, are absent.
| Neighborhood (Planning Department label) | Rooms, completed projects | Rooms, approved / under review |
|---|---|---|
| South Boston | 1,621 | 409 |
| South Boston Waterfront | 755 | 525 |
| Back Bay | 470 | — |
| Downtown | 359 | 647 |
| South End | 200 | — |
| Dorchester | 190 | 146 |
| Brighton | 162 | 170 |
| Roxbury | 108 | 68 |
| Fenway | 96 | 575 |
| West End | 77 | 511 |
| Allston | — | 291 |
| North End | — | 134 |
| Charlestown | — | 130 |
| East Boston | — | 123 |
| Chinatown | — | 106 |
| Total | 4,038 | 3,835 |
Source: Boston Planning Department (formerly BPDA), Development Projects database, all 26 neighborhood listings, accessed July 29, 2026. Rooms counted only where the project description states a figure. Neighborhoods with no stated room count in either category are omitted. The Seaport straddles two Planning Department labels, "South Boston Waterfront" and "South Boston."
Five waterfront projects carry the bulk of the completed total: the Summer Street Hotel at 1,054 rooms, Marine Wharf at 411, Seaport Square Block J at 326, Parcel K at 293 and Seaport Square Block A at 136. Their approvals clustered tightly. Board approvals granted in 2016 and 2017 alone account for 2,102 of the 4,038 completed rooms — 52% — and 84% of those 2016–2017 rooms went to the waterfront.
The pipeline has already left the Seaport
The 3,835 rooms approved, permitted or under review are spread far more evenly. Downtown leads with 647 rooms, ahead of Fenway (575), South Boston Waterfront (525), West End (511) and South Boston (409). The largest single items: the 438-room hotel at 391 D Street, board-approved in January 2026; the 391-room Kenmore Hotel; the 360-room hotel inside South Station Air Rights, permitted and under construction; and roughly 300 rooms in North Station Gateway, under review since September 2024.
Approval is not delivery. The 104-room Bayside DoubleTree expansion in Dorchester was board-approved in December 2014 and still shows as approved, not complete. Treat the pipeline column as an upper bound.
The regulated short-term rental layer is thin
Boston's short-term rental ordinance passed in June 2018 and registration opened January 1, 2019 (City of Boston, Inspectional Services; Analyze Boston). It limits short-term letting to owner-occupied units in one-, two- and three-family buildings and condominiums. Inside Airbnb, an independent project publishing scraped listing data, counted 4,414 Boston listings on June 15, 2026 — but only 2,571 accept stays shorter than 28 nights, the threshold at which the ordinance bites. The other 1,843 are month-plus rentals outside it. Of the 2,571 regulated listings, 1,769 are entire homes and 2,133 display a registration number.
What the numbers say
Book on brand and price alone and you will disproportionately land on the waterfront, because that is where the newest and largest inventory is. Historic Boston means a smaller, older stock: Back Bay and Downtown together show 829 completed Article 80 rooms against the waterfront's 2,220. And with occupancy at 77.3%, no season is soft enough for supply to rescue you — the 2025 gap between January ($194.66) and October ($386.46) decides your bill more than the neighborhood does. Check our neighborhood tool before you filter by star rating.
Frequently asked
How many hotel rooms does Boston have?
No current official citywide room total is published. Meet Boston states more than 35,000 hotel rooms for the Greater Boston area (accessed July 2026), and the Boston Planning Department counts 135 accommodation establishments in the city as of September 2024.
Which Boston neighborhood has the most new hotel rooms?
The South Boston waterfront. Completed Article 80 hotel projects there total 2,220 rooms across five buildings, 55% of the 4,038 completed rooms in the Planning Department's database as of July 2026.
How many hotel rooms are being built in Boston now?
3,835 rooms sit in projects that are approved, permitted or under review, led by Downtown (647), Fenway (575), South Boston Waterfront (525) and the West End (511). Board approval does not guarantee construction.
Sources
- Boston Planning Department (formerly BPDA), Development Projects database, 2026 — link
- Boston Planning Department, Research Division, Economy Report 2026 — link
- Boston Planning Department, Industry Profiles 2025: Culture, Sports, and Tourism Industry, 2025 — link
- Meet Boston (Greater Boston Convention & Visitors Bureau), hotel statistics, data by Pinnacle Advisory Group, 2019–2025 — link
- Meet Boston, "Why Boston," Greater Boston room inventory, accessed 2026 — link
- City of Boston, Inspectional Services Department, short-term rental ordinance and registration, 2018–2019 — link
- Analyze Boston, Short-Term Rental Eligibility dataset, updated 2026 — link
- Inside Airbnb, Boston listings file, June 15, 2026 — link
Reuse : these figures are free to reuse, quote and chart, with a link back to this page.
💡 Rooms are not evenly spread, and neither are rates. Start with our neighborhood-by-neighborhood hotel guides, then check the rest of the Data Room for the numbers behind Boston's hotel market.
